Approfondissez les données pour en découvrir davantage l’histoire.
Notre équipe s’engage à innover dans la communication des scores par groupe d’élèves pour soutenir de meilleures opportunités d’apprentissage pour tous les élèves. Nous avons commencé notre collaboration au sein d’une équipe de co-conception d’utilisateurs de données d’évaluation axés sur les politiques et de chercheurs qui ont collaboré pour développer de meilleures affichages des résultats largement utilisés. Nous avons dirigé l’équipe en tant que partenaires — les chercheurs ETS et l’expert en visualisation de données Eli Holder (3iap), qui venait de publier l’article révolutionnaire Comparaisons Injustes. Le printemps dernier, nous nous sommes réunis chaque deux semaines pour conceptualiser différentes façons de rapporter les résultats des tests en groupe d’élèves, qui feraient passer la réaction de « C’est comme ça » à « Nous pouvons aider les élèves en répondant aux besoins X, Y et Z ! » Tout au long de cette expérience, un mantra qui a guidé toutes nos conceptions était « Allez au-delà de la moyenne ». Dans ce blog, nous nous sommes de nouveau associés pour partager comment ce simple changement peut éclairer bien plus sur la performance des élèves.
Un récit de trois États
Depuis des années, les élèves du Massachusetts surpassent en moyenne les élèves d’autres États lors de l’évaluation de lecture de la National Assessment of Educational Progress (NAEP). Ils l’ont de nouveau fait en 2024 pour les classes de 4e et 8e. Ces notes élevées ont attiré l’attention des décideurs politiques et des leaders de l’éducation dans d’autres États qui utilisent les résultats du Massachusetts comme référence et comme indices pour orienter leurs propres politiques étatiques. Le Mississippi et la Louisiane, deux États qui ont historiquement obtenu des scores bien inférieurs au Massachusetts en lecture NAEP, ont été salués pour leurs gains de résultats en lecture NAEP, devenant des exemples pour d’autres États qui se tournent vers leurs politiques pour trouver des idées. Pourtant, bien que le Mississippi et la Louisiane aient grimpé dans le classement NAEP des États, leurs scores moyens restent inférieurs à ceux des États en tête comme le Massachusetts. Approfondir les données de la NAEP et aller au-delà des moyennes peut nous donner une compréhension plus claire et plus complète de ce que le Mississippi et la Louisiane ont accompli et comment le niveau de littératie de leurs élèves se compare entre eux et au Massachusetts.
Les graphiques de barres ne racontent pas toute l’histoire
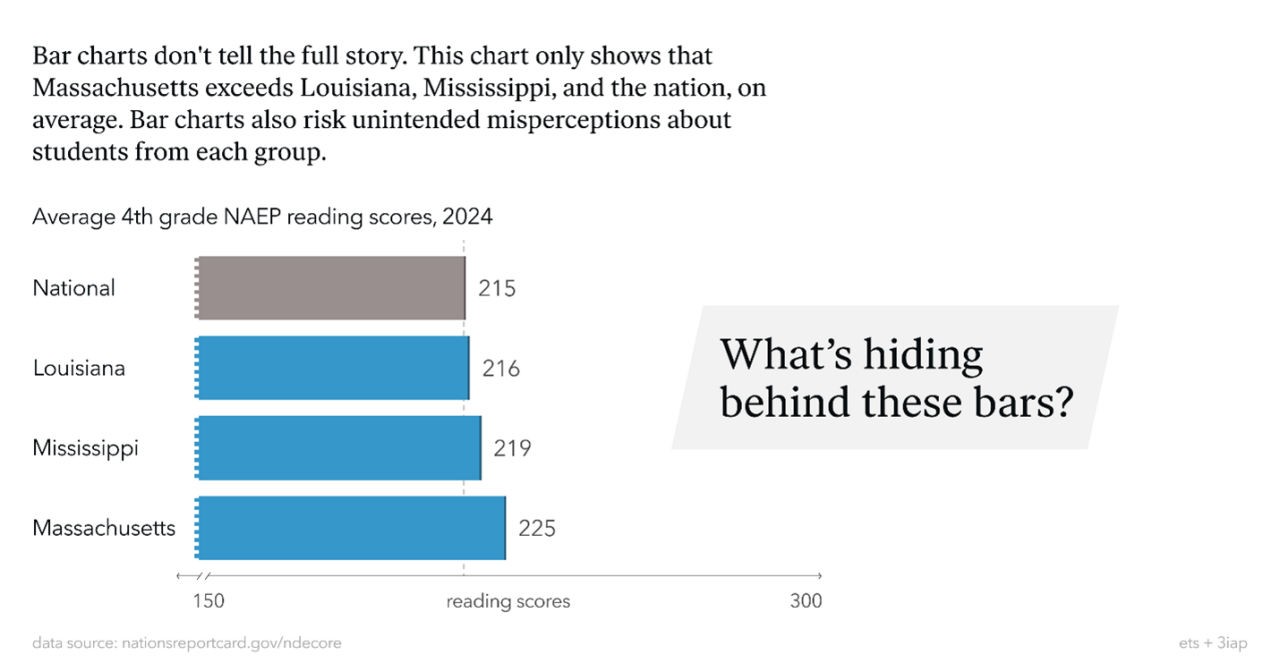
Figure 1. Un graphique à barres des scores moyens de lecture en 4e année lors de l’Évaluation nationale du progrès éducatif 2024 (NAEP) montre que le Massachusetts a obtenu en moyenne des scores plus élevés que la Louisiane, le Mississippi et le pays.
Le NAEP Data Explorer (NDE), qui offre aux utilisateurs un accès par menus à un véritable trésor de données NAEP, nous a permis d’examiner la performance en lecture des élèves de 4e année au niveau de l’État. La Figure 1 présente un graphique à barres des scores moyens de lecture NAEP de 4e année pour le pays ainsi que pour la Louisiane, le Mississippi et le Massachusetts. Bien que ces graphiques aient autrefois été une convention populaire, ils sont trompeurs à bien des égards, conduisant notamment à la pensée déficitaire. Nous notons quelques observations de ce simple graphique à barres :
- Les élèves du Massachusetts affichent la meilleure moyenne de lecture en 4e année aux États-Unis, avec un score moyen de 225, soit 10 points de plus que la moyenne nationale de 215 pour 2024. Cette différence n’est pas un bruit aléatoire. Elle est statistiquement significative, comme toutes les autres différences notées tout au long du blog.
- Le Mississippi a obtenu le score moyen suivant le plus élevé parmi les trois États avec 219, soit 6 points de moins que le Massachusetts mais 4 points de plus que le pays.
- Le score moyen de la Louisiane, de 216, était similaire à celui du pays dans son ensemble.
Les percentiles aident à définir la distribution nationale des scores
En plus des moyennes, le NAEP Data Explorer fournit des données au niveau de l’État par plusieurs percentiles. Les percentiles divisent un échantillon d’élèves en 100 parties égales, chacune représentant 1 % des élèves. Lorsque nous parlons d’un percentile spécifique, nous faisons référence à la valeur à ou en dessous de laquelle un certain pourcentage d’élèves se situe. Par exemple, si le score d’un élève est au 75e percentile, cela signifie que son score est égal ou supérieur à 75 % de celui de tous les autres élèves. Tracer plusieurs points percentiles nous aide à mieux comprendre comment les scores se comparent dans toute la distribution des élèves.
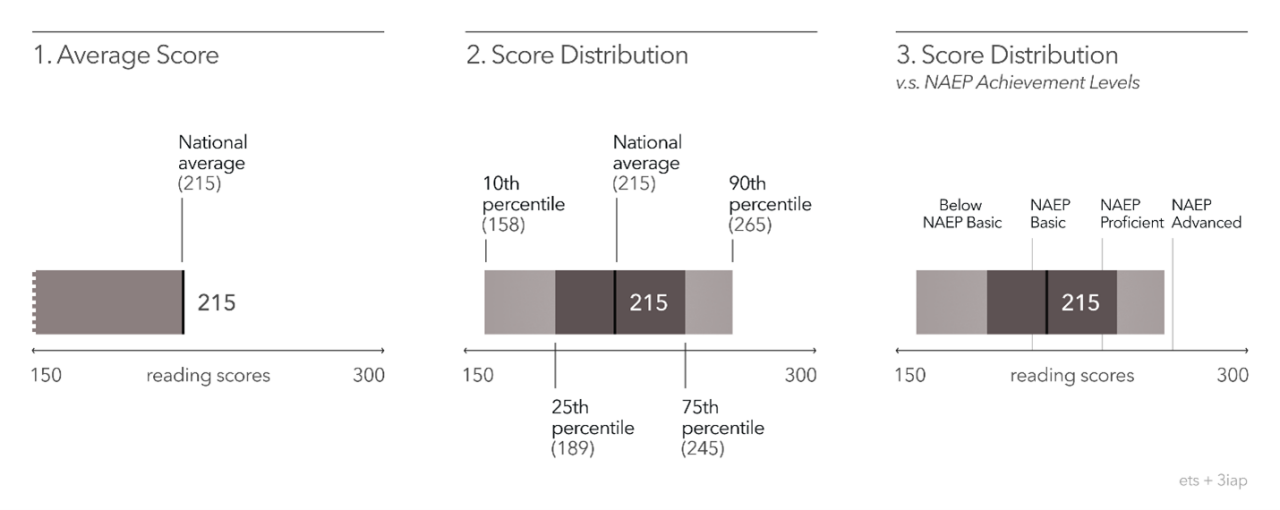
Figure 2. Graphique annoté de distribution des scores de lecture NAEP de 4e année 2024 pour le pays.
De gauche à droite, les panneaux de la Figure 2 montrent comment une superposition supplémentaire d’informations fournit des informations sur les scores des élèves par rapport à l’échelle NAEP.
- Dans le panneau de gauche, on voit qu’un simple graphique à barres ne donne qu’un seul point — la moyenne nationale. Dans ce genre de graphiques, les utilisateurs ont tendance à se faire leur propre idée de la répartition des scores à l’intérieur ou autour de la barre, ce qui peut entraîner des malentendus des données et expliquer pourquoi certains groupes ont des scores plus bas que d’autres.
- Dans le panel du milieu, nous utilisons un graphique de répartition des scores pour mettre en évidence les scores que les élèves ont eu tendance. Ici, la section la plus sombre montre que les 50 % du milieu des élèves à l’échelle nationale ont obtenu un score de 189 (25e percentile) à 245 (75e percentile).
- Le panneau de droite ajoute les niveaux de réussite NAEP pour fournir un point de référence pour interpréter les percentiles de score. Les niveaux de réussite décrivent la manière dont les élèves démontrent leurs connaissances et compétences, NAEP Basic représentant une maîtrise partielle. Ici, la section la plus sombre montre que les 50 % intermédiaires des scores des élèves couvrent trois niveaux de performance : en dessous de NAEP Basic, NAEP Basic et NAEP Proficient. De plus, le 90e percentile est juste en dessous du niveau NAEP Advance, ce qui signifie que moins de 10 % des élèves ont obtenu un score suffisamment élevé pour atteindre le niveau avancé.
Les percentiles aident à définir la distribution nationale des scores
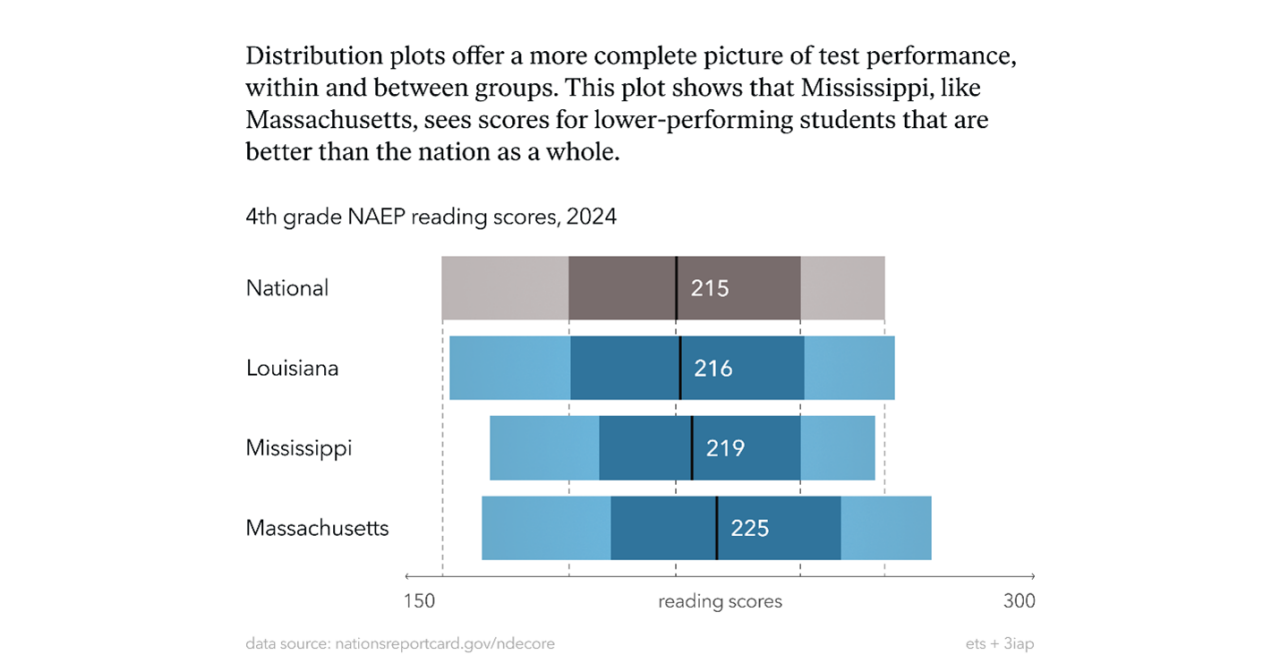
Figure 3. Graphiques de distribution des scores de lecture NAEP de 4e année 2024. Les scores moyens de lecture pour la nation et chaque État sont indiqués en blanc. Des lignes verticales pointillées indiquent les points percentiles pour la distribution nationale.
Regardez la figure 3. Voyez-vous ce que nous voyons ? Le côté gauche de la distribution du Mississippi ressemble davantage à celui du Massachusetts qu’à celui du pays ou de la Louisiane. Les 10e percentiles du Mississippi et du Massachusetts sont environ 10 points plus élevés que ceux du pays.
Le Mississippi et le Massachusetts sont tous deux en train de voir
Meilleurs scores pour les élèves moins performants
que la nation dans son ensemble.
Que voyez-vous à l’extrémité droite de la distribution ? Là-bas, les scores du Mississippi sont inférieurs à ceux du Massachusetts (de 13 points) et de la Louisiane (de 4 points).
Les élèves les plus performants du Mississippi
peut avoir besoin de plus de soutiens pour atteindre le
Même niveau de performance que les élèves dans d’autres États.
L’intrigue s’épaissit : découpe des résultats par situation économique des élèves
Le NAEP collecte également des données sur plusieurs caractéristiques des élèves, comme la défavorisation économique des familles des élèves. Lorsque nous décomposons les scores par statut économique, nous voyons une image plus complète des scores en lecture en 4e année dans le Mississippi, la Louisiane et le Massachusetts (voir Figure 4).
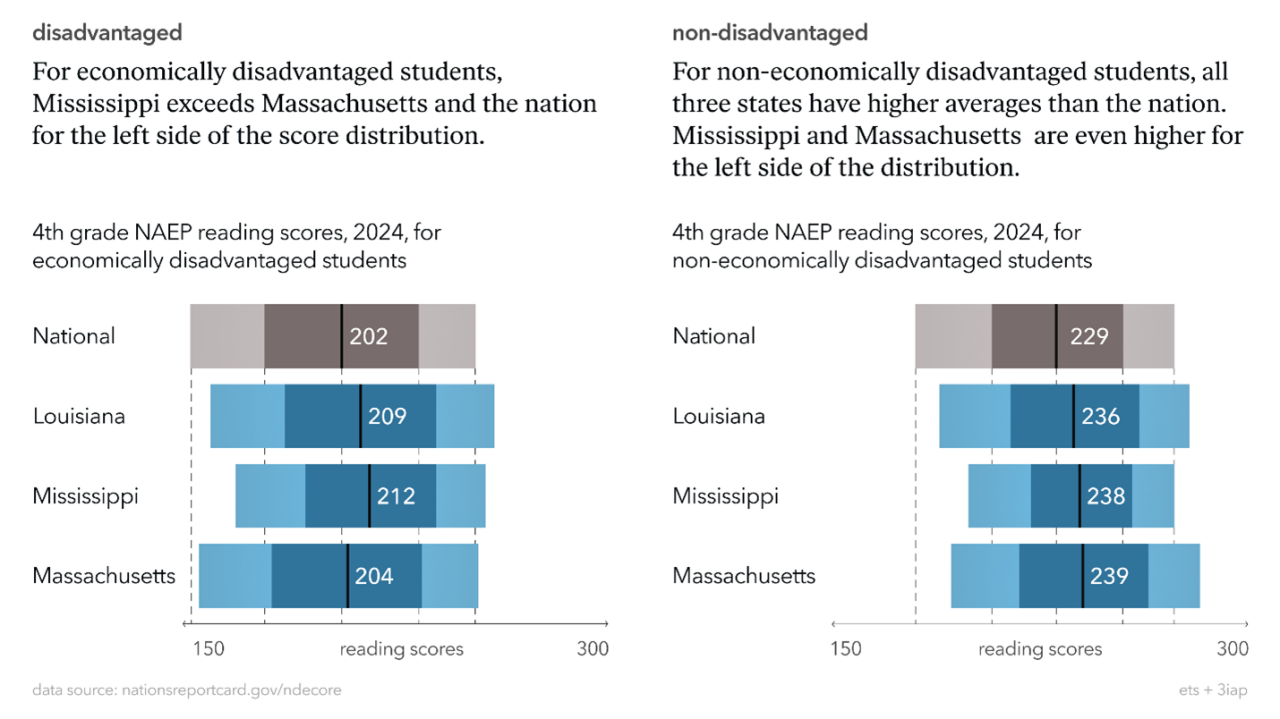
Figure 4. Graphiques de répartition des scores de lecture du NAEP de 4e année décomposés par statut économique familial. Les scores moyens de lecture de 4e année par statut économique familial pour la nation et chaque État sont indiqués en blanc. Des lignes verticales pointillées indiquent les points percentiles pour la distribution nationale.
Lorsqu’on analyse si les familles des élèves sont économiquement défavorisées, les scores en lecture varient considérablement et sont généralement plus élevés pour les élèves issus de familles non économiquement défavorisées. Certains États semblent mieux réussir que d’autres à enseigner la lecture aux élèves économiquement défavorisés.
Voyez-vous ce que nous voyons en regardant le panneau de gauche de la Figure 4 ?
Le Mississippi et la Louisiane dépassent tous deux la nation dans son ensemble
En ce qui concerne la performance des élèves
Issues de familles économiquement défavorisées.
- Le Mississippi affiche le score moyen de lecture en 4e année (212) parmi les élèves économiquement défavorisés, 8 points de plus que le Massachusetts (204) et 10 points de plus que le pays (202).
- Les 10e et 25e percentiles pour les étudiants économiquement défavorisés sont tous deux plus élevés dans le Mississippi que dans le Massachusetts, de 13 points, même si, proportionnellement, presque deux fois plus d’étudiants économiquement désavantagés dans le Mississippi (75 %) que dans le Massachusetts (40 %).
- Les élèves du Mississippi dépassent la nation à chaque percentile de la distribution des scores de 6 à 15 points, sauf pour les élèves ayant obtenu les meilleurs scores (au 90e percentile), avec les plus grandes différences à l’extrémité gauche de la distribution.
- Avec 73 % de ses élèves économiquement défavorisés, la Louisiane surpasse systématiquement la nation d’environ 7 points à chaque point percentile sauf au plus bas.
En regardant le panneau de droite de la Figure 4, qui montre les distributions des scores pour les élèves non économiquement défavorisés, nous avons menés aux observations suivantes et à une question approfondie.
- Les trois États ont tous des scores moyens supérieurs à ceux de l’ensemble du pays, de 7 à 10 points.
- En regardant le côté gauche des distributions, le Mississippi et le Massachusetts ont des percentiles nettement supérieurs au 10e et 25e percentiles par rapport à l’ensemble du pays — de 10 à 20 points.
- La plus grande distinction est le 10e percentile du Mississippi, qui est 20 points plus haut que celui du pays.
- Quels soutiens ces États pourraient-ils offrir aux étudiants non défavorisés économiquement et ayant le plus de besoins ?
Le niveau scolaire fait une différence dans cette histoire
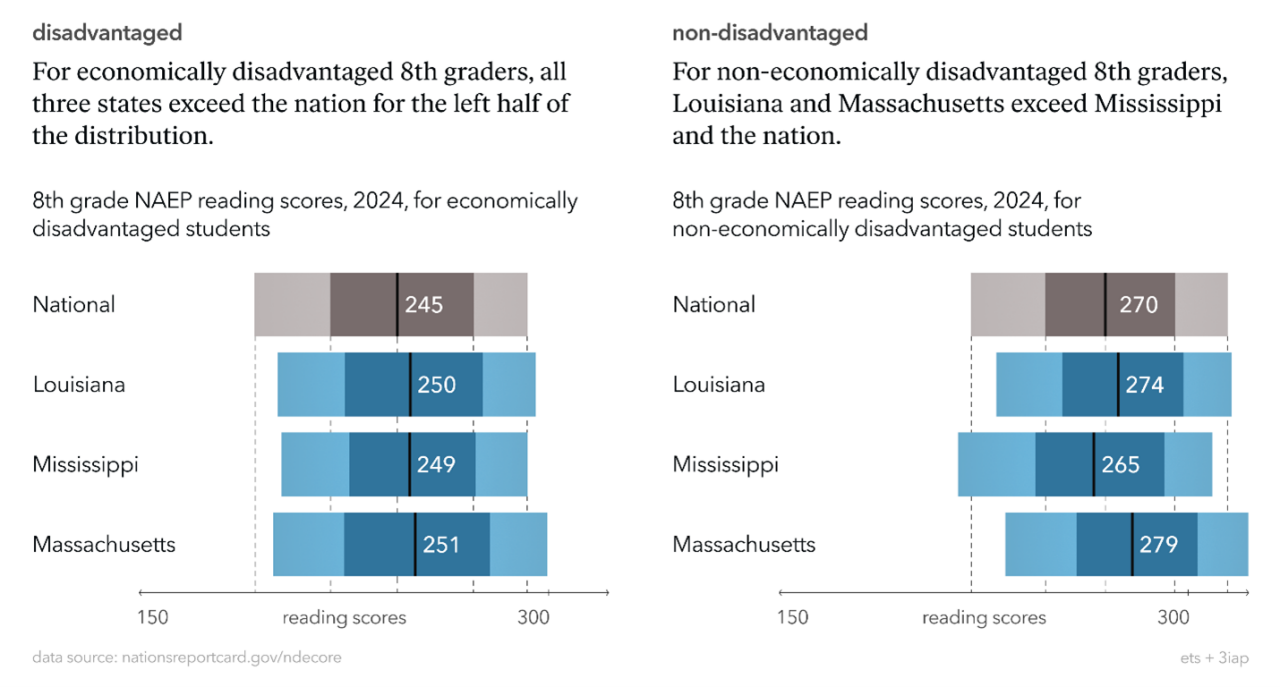
Figure 5. Graphiques de distribution des scores de lecture du NAEP de 8e année décomposés par statut économique familial. Les scores moyens de lecture de 8e année par statut économique familial pour la nation et chaque État sont indiqués en blanc. Des lignes verticales pointillées indiquent les points percentiles pour la distribution nationale.
Passons aux données de la NAEP pour la 8e année de nos trois États afin de voir si les tendances sont confirmées. En découpant les scores par statut économique familial, les graphiques de répartition des scores dans le panneau de gauche de la Figure 5 montrent que le Mississippi et la Louisiane sont au même niveau que le Massachusetts parmi les élèves économiquement défavorisés en 8e année. Les trois États surpassent globalement la nation dans la partie gauche à la moyenne des distributions.
Cependant, pour les élèves qui ne sont pas économiquement défavorisés, le Mississippi offre une marge de progression par rapport aux autres États et à la nation. En regardant le panneau de droite de la Figure 5, nous faisons les observations suivantes :
- Comparé au Massachusetts et à la Louisiane, le Mississippi obtient des scores inférieurs dans toute la distribution, tant pour les élèves les plus élevés que les plus faibles.
- Par exemple, dans le Mississippi, le 25e percentile est à 243, soit 15 points de moins que le 25e percentile du Massachusetts qui est de 258, et 10 points de moins que celui de la Louisiane à 253.
- Ce résultat pour les élèves de 8e année du Mississippi non défavorisés économiquement est très différent de celui de la 4e année, suggérant que les interventions de lecture pourraient devoir être adaptées aux besoins des élèves à mesure qu’ils développent des compétences de lecture plus avancées en classes supérieures.
- En revanche, pour les étudiants non économiquement défavorisés, la Louisiane obtient des résultats plus similaires à ceux du Massachusetts — souvent en dépassant le Mississippi de jusqu’à 10 points.
Leçons clés révélées par les distributions nationales des scores d’évaluation
En utilisant un programme d’évaluation commun, les données NAEP peuvent fournir des comparaisons précieuses et détaillées des performances des élèves entre les États.
Les scores moyens du NAEP montrent que les élèves du Massachusetts surpassent ceux de Louisiane, du Mississippi et du pays dans l’ensemble, mais s’arrêter aux moyennes ferait passer à côté des spectateurs de niveaux de réussite plus élevés dans le Mississippi et la Louisiane pour les élèves ayant des scores plus faibles. Plus précisément, le Mississippi, et parfois la Louisiane, surpasse le Massachusetts et/ou le pays dans son ensemble en lecture de la 4e année pour
- les élèves ayant les scores les plus bas dans tout l’État ;
- les élèves économiquement défavorisés, en particulier ceux ayant obtenu des scores égaux ou inférieurs à la moyenne ; et
- les élèves non économiquement défavorisés, en particulier ceux qui se situent dans les 10e et 25e percentiles inférieurs.
- La Louisiane et le Mississippi suivent globalement le rythme du Massachusetts en termes de résultats en lecture de la 8e année, en particulier parmi les élèves économiquement défavorisés. Il y a encore une marge d’amélioration des scores de lecture de la 8e année du Mississippi, en particulier chez les élèves non défavorisés économiquement.
Leçons clés révélées par les distributions nationales des scores d’évaluation
Nous espérons que les responsables de l’éducation de l’État pourront utiliser ces résultats comme un saut
Un point de départ pour essayer d’en apprendre davantage sur les politiques et pratiques qui ont conduit
La Louisiane et le Mississippi pour surperformer la nation ou d’autres États,
Surtout pour améliorer les résultats en lecture avec des scores plus bas
les étudiants et les étudiants économiquement défavorisés.
Une exploration plus approfondie des performances des élèves par l’enseignant et les caractéristiques de l’école disponibles dans le NAEP Data Explorer pourrait vous montrer quelles pratiques enseignantes et scolaires peuvent être liées à une meilleure performance des élèves dans ces États ou dans votre propre État. Cliquez ici pour commencer votre propre exploration des données.
Marisol Kevelson, Katherine E. Castellano et Emily Kerzabi travaillent à l’Institut de recherche ETS. Mari est chercheuse associée ; Katherine est chercheuse principale ; Emily est gestionnaire de projet de recherche. Eli Holder est le fondateur de 3iap.